Using Eclipse's MAT to analyze memory leaks
Using Eclipse's MAT to analyze memory leaks
MAT is a a free utility provided by the Eclipse Foundation. It's extremly helpful when it comes to analyzing heapdumpds from the plugin Spark
We'll require both Spark on our server, and MAT on our PC for this guide.
This guide is meant for Windows, please reach out to our support team for steps to run MAT on Linux.
Keep in mind you'll need at least as much RAM as the server uses during peak usage to run MAT on your PC.
Preparation
Your server is likely to crash whenever you take a heapdump. This is especially the case if the memory leak is severe.
First, we'll head over to our Minecraft server and patiently wait until ram usage reaches the highest value possible, to simplify our task. GC runs in cycles, so you can keep an eye on usage with the command /spark healthreport --memory.
When the time is right we can grab our heapdump with /spark heapdump --compress gzip
We'll need to download our heapdump file from plugins/spark/. The precise name will be given in chat or console when you run the command, but the file will always end with hprof.gz, as we decided to use gzip for compression.
It's MAT Time
Before using MAT we'll want to ensure we have Java 17 or newer installed. We can grab this directly from Oracle.
With the right version of Java in our PC, we can now unarchive both the MAT files which we grabbed from Eclipse's Website and the hprof.gz file we downloaded from our Bloom server.
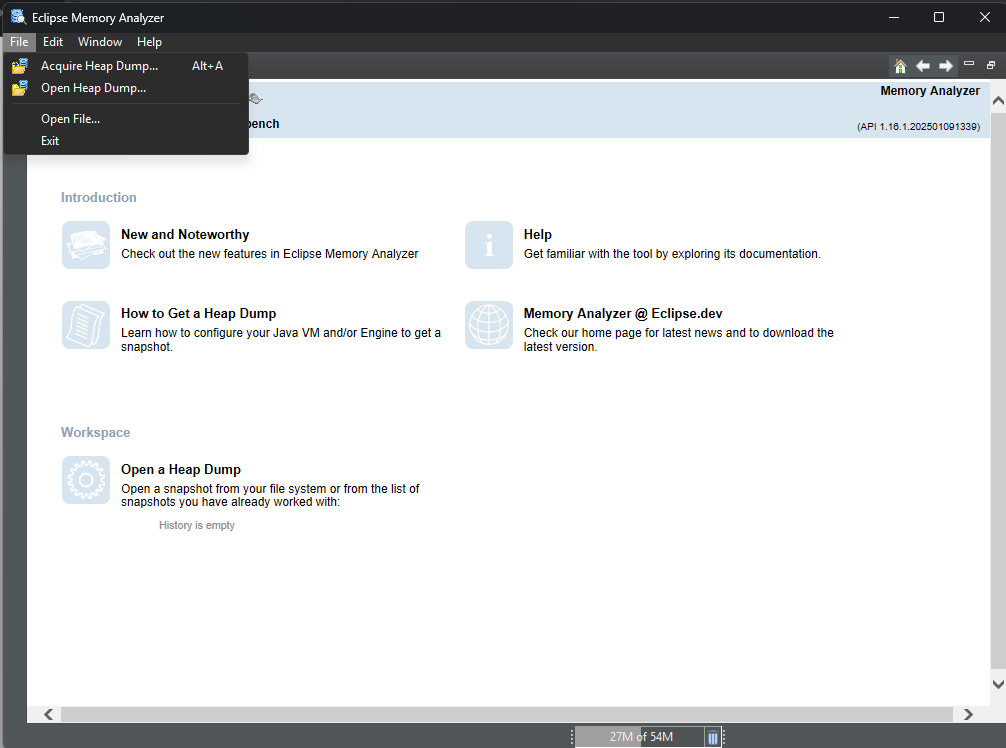
Once we open MAT, we'll need to click "Files", then "Open Heap Dump"
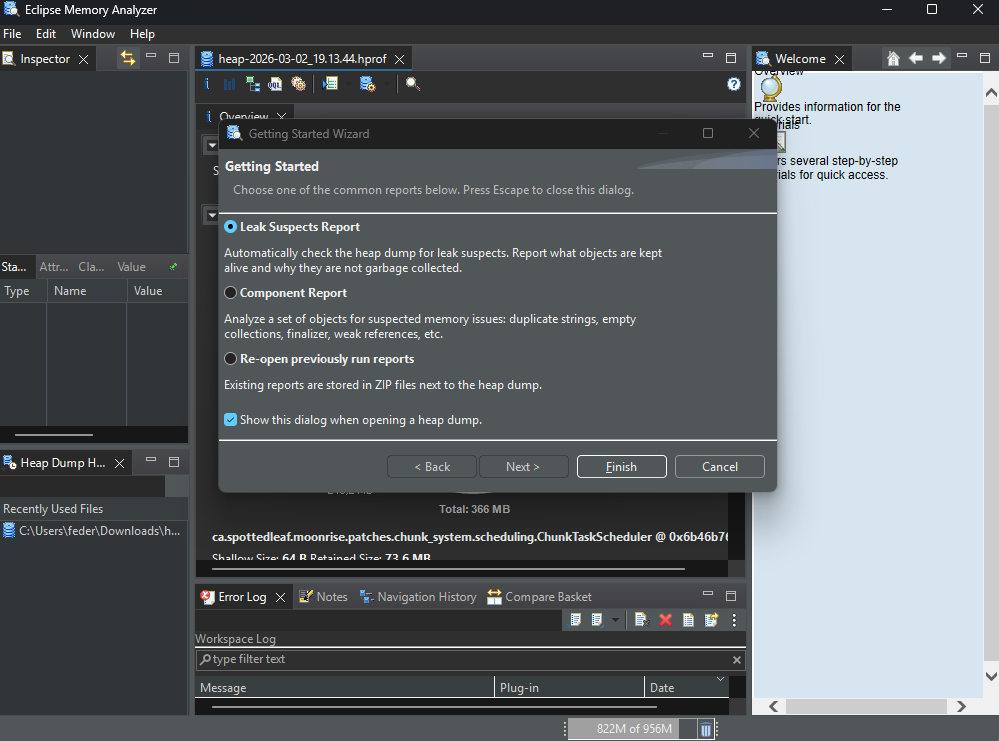
MAT Will automatically grab and mount the file for review, once the software is ready it'll prompt us to specify the type of report we would like to take. In this case, we'll want to select "Leak Suspect Report".
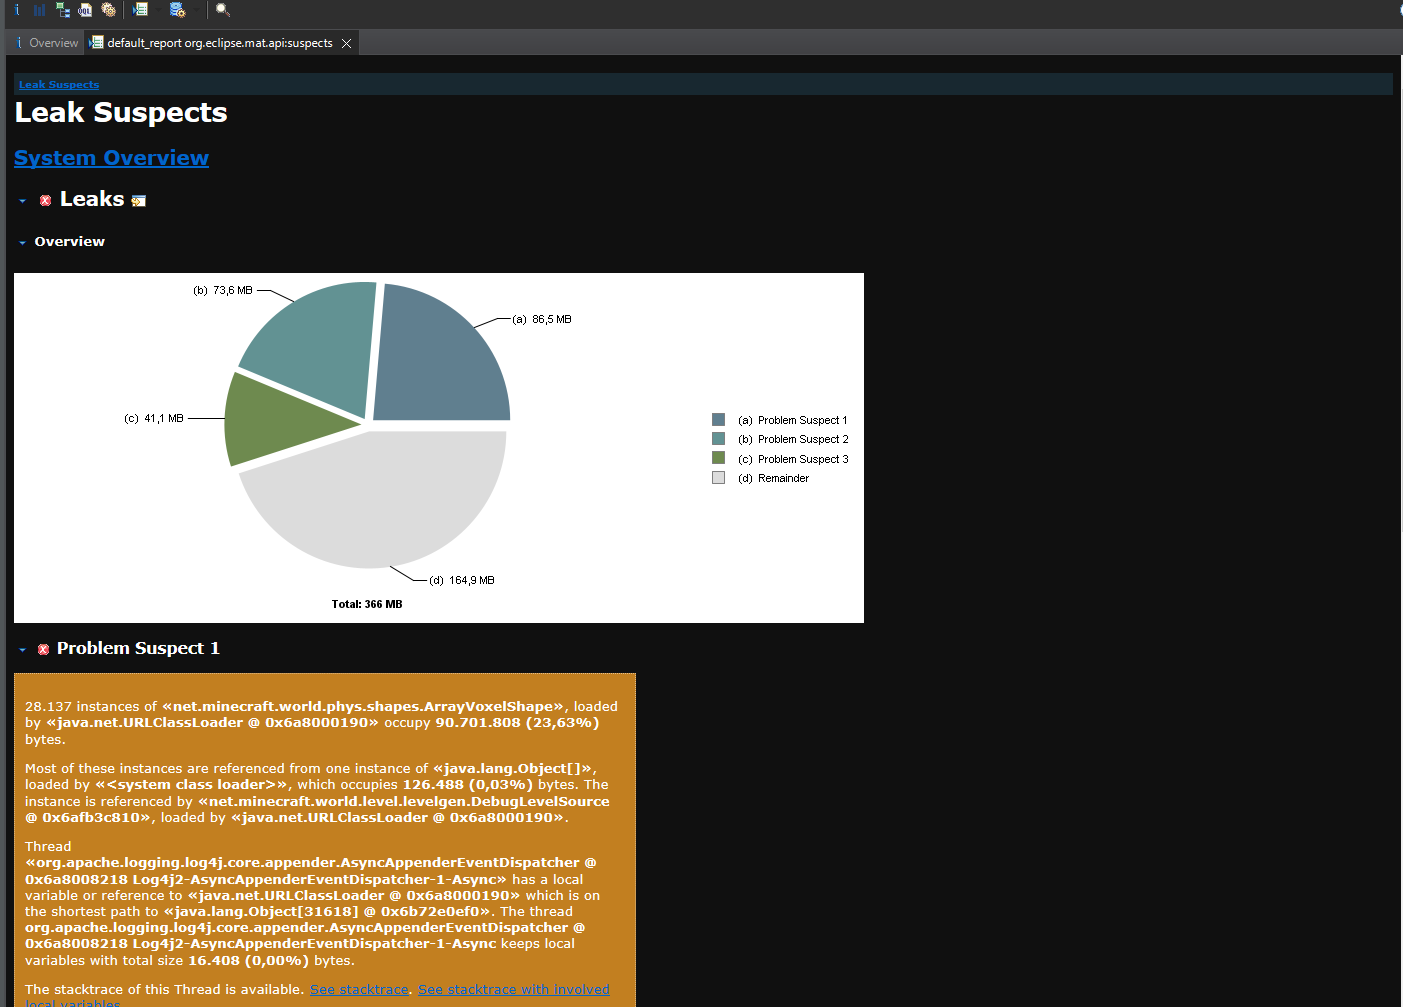
After some processing it'll provide us with a list of suspected leaks. They will be shown in order of heap usage by their corresponding class name. The class name is key to finding out what's using up all your memory. Besides checking for anything that might be familiar within said names, we can also Google the class name to try and find a GitHub repository. MAT will always show leak suspects, so a healthy server can also produce a "Leak Suspects Report" which is actually completely normal.
MAT Issues
The most common issue one can come accross with MAT is simply running out of heap space for the software. To try and fix this, we'll locate our MemoryAnalyzer.ini file within the MAT directory and right click it to edit. Within this file we'll modify -Xmx1024m to be equal to your total RAM in GBs - 4 GBs, then multiplied by 1024. So if we have 16GBs on our PC, we can set it to -Xmx12228m.
The wrong version of Java got picked up? You can also specify the Java exe to be used by adding:
-vm
C:\path/to/java/exe
In my case it would look like:
-vm
C:\Program Files\Java\jdk-21\bin\javaw.exe